[book] Hands-On Machine Learning with Scikit-Learn and TensorFlow
A study note of [1]
Highlights on iPad to be organized
Classification
Performance Measures
Accuracy
- Defined as the rate/percent of cases that correctly classified out of the total number of samples.
- Accuracy is generally not the preferred performance measure for classifiers, especially when you are dealing with skewed datasets (i.e., when some classes are much more frequent than others
Confusion Matrix
- A much better way to evaluate the performance of a classifier. The general idea is to count the number of times instances of class A are classified as class B
>>> from sklearn.metrics import confusion_matrix >>> confusion_matrix(y_train, y_train_pred)- Each row in a confusion matrix represents an actual class, while each column represents a predicted class.
Predicted (-) Predicted (+) True (-) True negative False positive True (+) Flase negative True positive
- Each row in a confusion matrix represents an actual class, while each column represents a predicted class.
Precision and Recall
-
Precision: accuracy of the positive predictions (a.k.a. pisitive predicted values)
$$\text{Precision} = \frac{\text{TP}}{\text{TP + FP}}$$ -
Recall: sensitivity or true positive rate (TPR)
$$\text{Recall} = \frac{\text{TP}}{\text{TP + FN}}$$from sklearn.metrics import precision_score, recall_score precision_score(y_train, y_pred) recall_score(y_train, y_pred) -
It is often convenient to combine precision and recall into a single metric called the F1 score
$$F_1 = \frac{1}{\frac{1}{\text{precision}} + \frac{1}{\text{recall}}} = \frac{\text{TP}}{\text{TP} + \frac{\text{FN + FP}}{2}}$$- It is the harmonic mean gives much more weight to low values. As a result, the classifier will only get a high F1 score if both recall and precision are high.
- Can be used to compare two classifiers
- The F1 score favors classifiers that have similar precision and recall.
>>> from sklearn.metrics import f1_score >>> f1_score(y_train, y_pred) -
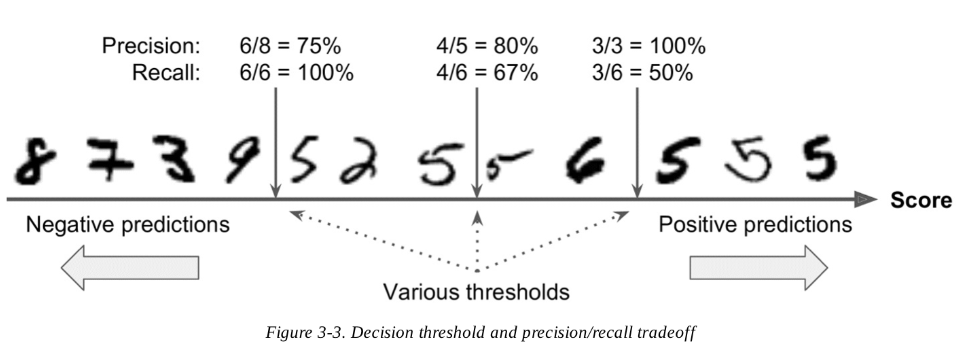
You can’t have it both ways: increasing precision reduces recall, and vice versa. This is called the precision/recall tradeoff.

-
Scikit-Learn does not let you set the threshold directly, but it does give you access to the decision scores that it uses to make predictions. Instead of calling the classifier’s
predict()method, you can call itsdecision_function()method, which returns a score for each instance, and then make predictions based on those scores using any threshold you want -
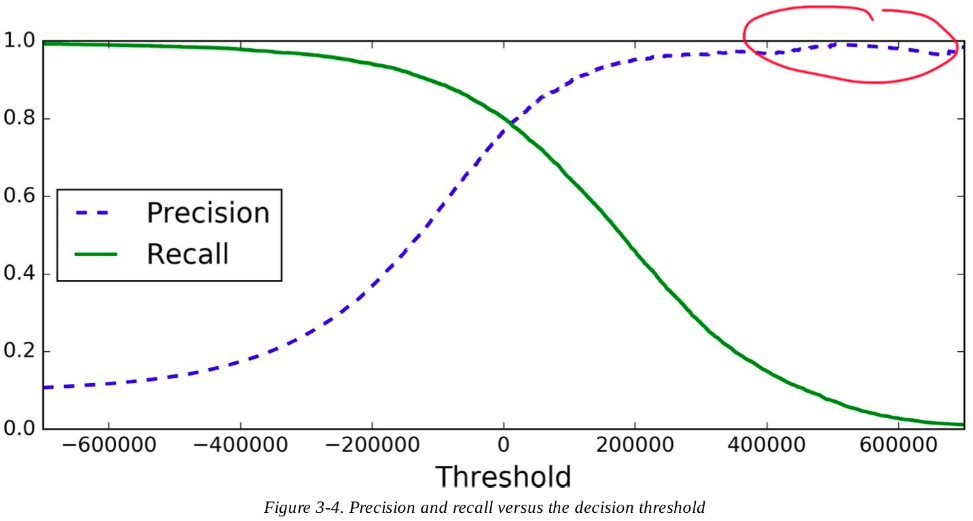
To find the "optimal" threshold, we can calculate the scores for all instances in the training set using
cross_val_predict()with specifyingmethod = "decision_function"instead of acutal predictions- with these scores, plot the
precision_recall_curve()for all possible threshold>>> from sklearn.metrics import precision_recall_curve >>> precisions, recalls, thresholds = precision_recall_curve(y_train, y_scores)
- with these scores, plot the
-
Another way to select a good precision/recall tradeoff is to plot precision directly against recall
-
Precision may sometimes go down when you raise the threshold (although in general it will go up); recall can only go down when the threshold is increased, which explains why its curve looks smooth.
-
The ROC Curve
-
It is very similar to the precision/recall curve, but instead of plotting precision versus recall, the ROC curve plots the true positive rate (sensitivity, another name for recall) against the false positive rate (1-specificity).
- One way to compare classifiers is to measure the area under the curve (AUC).
>>> from sklearn.metrics import roc_curve >>> fpr, tpr, thresholds = roc_curve(y_train, y_scores) >>> from sklearn.metrics import roc_auc_score >>> roc_auc_score(y_train, y_scores)- Once again there is a tradeoff: the higher the recall (TPR), the more false positives (FPR) the classifier produces
-
ROC curve vs. precision/recall: As a rule of thumb, you should prefer the PR curve whenever the positive class is rare or when you care more about the false (predicted) positives than the false negatives, and the ROC curve otherwise.
References
G{'e}ron, Aur{'e}lien (2019). Hands-on machine learning with Scikit-Learn, Keras, and TensorFlow: Concepts, tools, and techniques to build intelligent systems. ↩︎